news
Open sourcing our Flutter Web Data Visualization
The full source code and an inside look at optimizing our data visualization made for the launch of Flutter Web at Google I/O 2019.
The full source code and an inside look at optimizing our data visualization made for the launch of Flutter Web at Google I/O 2019.
We’ve been fans of the Flutter cross platform development framework since it was in early alpha. We wrote our first big app with it back in the fall of 2017 and immediately fell in love with how rapidly we were able to develop apps for both iOS and Android. It wasn’t just the cross platform support that sold us though, everything about the project is done thoughtfully and with the highest regard for developer experience.
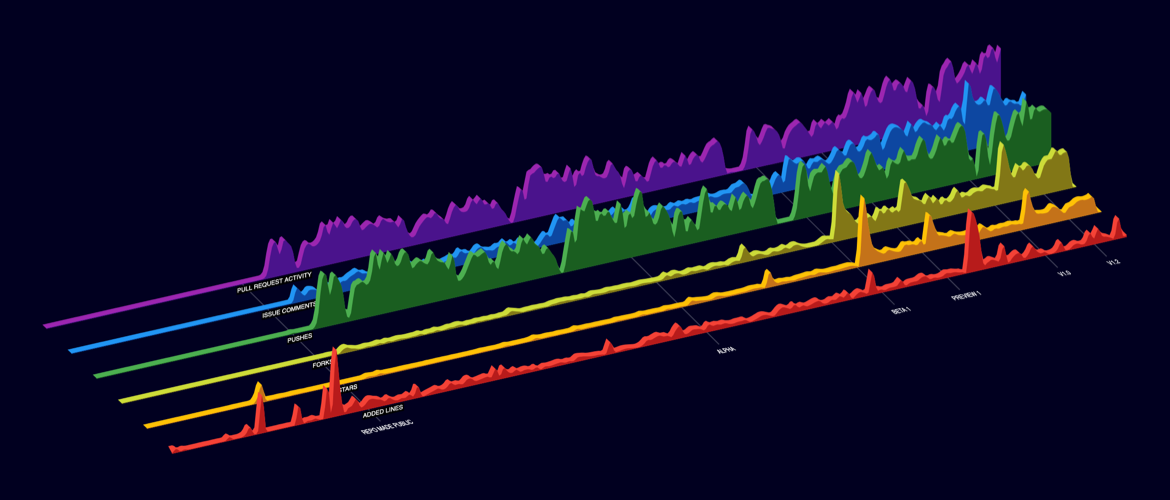
We were then obviously super excited about the opportunity to develop a demo for the new Flutter Web project being released at I/O 2019. Our idea was to visualize the growth in activity in the Flutter Github project, while showing off the drawing and animation capabilities of Flutter. Click here to view a full screen version of the project where you can interact with the timeline.
The source for the project is also now available on Github at larvalabs/flutterweb_github_dataviz. We thought we would highlight a few interesting parts of the code for other Flutter developers.

The app is essentially made up of two main widgets, the layered chart and the timeline below. The animation is run by an AnimationController that sends out a new value between 0 and 1 every frame. We interpolate that value slightly to provide the pause at the end of each animation loop, but for the most part that animation value is sent down the widget tree and drives the animation in the chart and timeline. If you click on the timeline widget however, we override that animation value with one based on the click position in the timeline. This is one of the amazing things about Flutter (and other reactive UI frameworks): once you set that value, all the necessary interface updates happen automatically. As you drag the mouse on the timeline, we’re just updating that animation value, and when you release we just resume the AnimationController from that point. The layered chart doesn’t care whether it’s being driven by the animation, or user input on the timeline. It’s much simpler than how things need to be done in non-reactive frameworks.
The other interesting areas are related to render performance. In order to achieve a smooth 60fps there were two major optimizations we needed to do. The first was caching the paths for the layered charts, which you can see here in layered_chart.dart. Instead of recreating the paths on each frame, we generate them whenever the window size changes and just draw them with a sliding clip path. The other major optimization was to pre-generate the TextPainters for both the timeline and chart labels. You can see them being generated for the timeline here. The textPainer.layout() call is fairly expensive, depending on the typeface used, so doing this outside of the draw loop is critical to avoid dropped frames.
There are a few other handy utilities that we ported to Dart. The simple ‘map’ function in this utility class is invaluable when animating values. There is also a Catmull spline interpolator, which is useful for smoothly moving a value between control points.
Overall, our experience with Flutter Web was amazing. Almost everything “just worked” and we were able to write Flutter without caring that it was a website rather than a mobile app. The promise of a single codebase to target desktop, mobile and web is a huge step forward. We’re super excited to see how Flutter develops.