web
Github Data Visualization using Flutter Web
A Data Visualization made for the launch of Flutter Web at Google I/O 2019.
A Data Visualization made for the launch of Flutter Web at Google I/O 2019.
Flutter is an exciting new cross-platform development framework from Google that promises to radically change app development. We've been fans of Flutter since the Alpha version, so when we were offered the opportunity to make something for the launch of Flutter Web at Google I/O, we jumped at the chance.
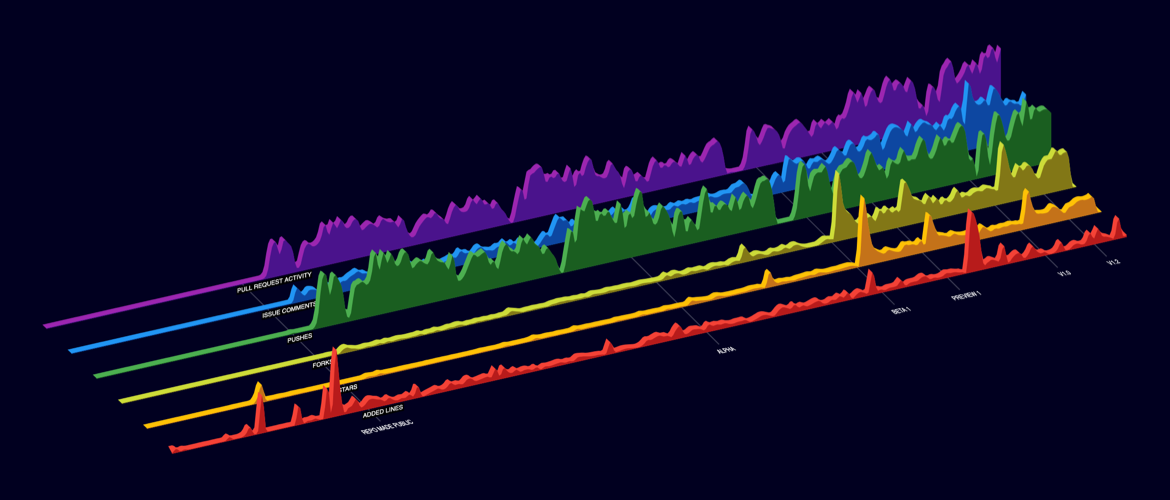
Since the Flutter project has experienced explosive growth in the past year, we decided to create an animated data visualization to illustrate the activity of the Flutter project on Github.
We first wrote data collection tools that gathered commits, stars, forks, pull requests and comment activity over the 4+ year lifespan of the project. We then took this data and wrote an animated "layered area chart" with an interactive timeline widget. Clicking on the timeline allows you to pause the animation and scrub back and forth. Click here to view a full screen version of the project where you can interact with the timeline.

We are proud to have our project included in the official Flutter Web samples gallery and we've open sourced the code on github.